GDP Counts the Ambulance, Not the Injury
An accident at a chemicals plant sends people to the hospital, and to the morgue. GDP sees these as additive. We offer a new, true way to measure economic growth.
Is it literally true that when a chemical plant's fireball accident sickens many and kills a few, their care at the hospital and the services of the mortuary and the cemetery count as added economic activity, increasing GDP?
It is true.
This happens because GDP measures the total monetary value of goods and services exchanged for money, and is entirely oblivious to why money is being spent. There is no deduction for human suffering or environmental depletion. As a result, the costs of externalised harms are recorded as gains.
This truth means that GDP tallies the total of economic outputs of companies, industry sectors, nations. Meanwhile, our estimates to date show that externalities amount to approximately 30% of total global economic output. The system of GDPs is missing vast costs — so vast that GDP can no longer be an accurate representation of the truth of the economy.
Criticism is widespread, and it’s not new. Here’s Robert F. Kennedy in March, 1968, speaking at the University of Kansas:
Our Gross National Product… counts air pollution and cigarette advertising, and ambulances to clear our highways of carnage. It counts special locks for our doors and the jails for the people who break them. It counts the destruction of the redwood and the loss of our natural wonder in chaotic sprawl… It measures everything, in short, except that which makes life worthwhile.
Fifty-eight years later, the measure remains unchanged. GDP does the job it was designed to do — counting production — but no companion measure has emerged to account for the costs that production imposes on society and the environment.
So let us not throw out GDP. Let us build the missing system to complement it.
What follows starts with an example of counting the costs of production to illustrate how this might work. We use a hypothetical chemical plant accident, with estimated consequences and costs based on representative analysis. We put the year of the accident through two accounting systems and see what each records. We use our calculations of externalities to illustrate how we might want to count costs instead. We call our approach NEO: Net Economic Output.
Note: It’s only the imagined accident and its consequences we look at, not the imaginary ongoing business, which may have enormous other costs. After looking at the hypothetical accident through GDP and NEO lenses, we compare what we offer to other approaches.
A plant, before anything goes wrong
Take a theoretical chemicals firm with one large plant. It employs 800 people, turns over $3 billion a year, and earns a 10% net margin — $300m of profit on $2.7bn of operating cost. That’s at the high end of margins for bulk chemicals, and slightly lower than the range for specialty chemicals firms.
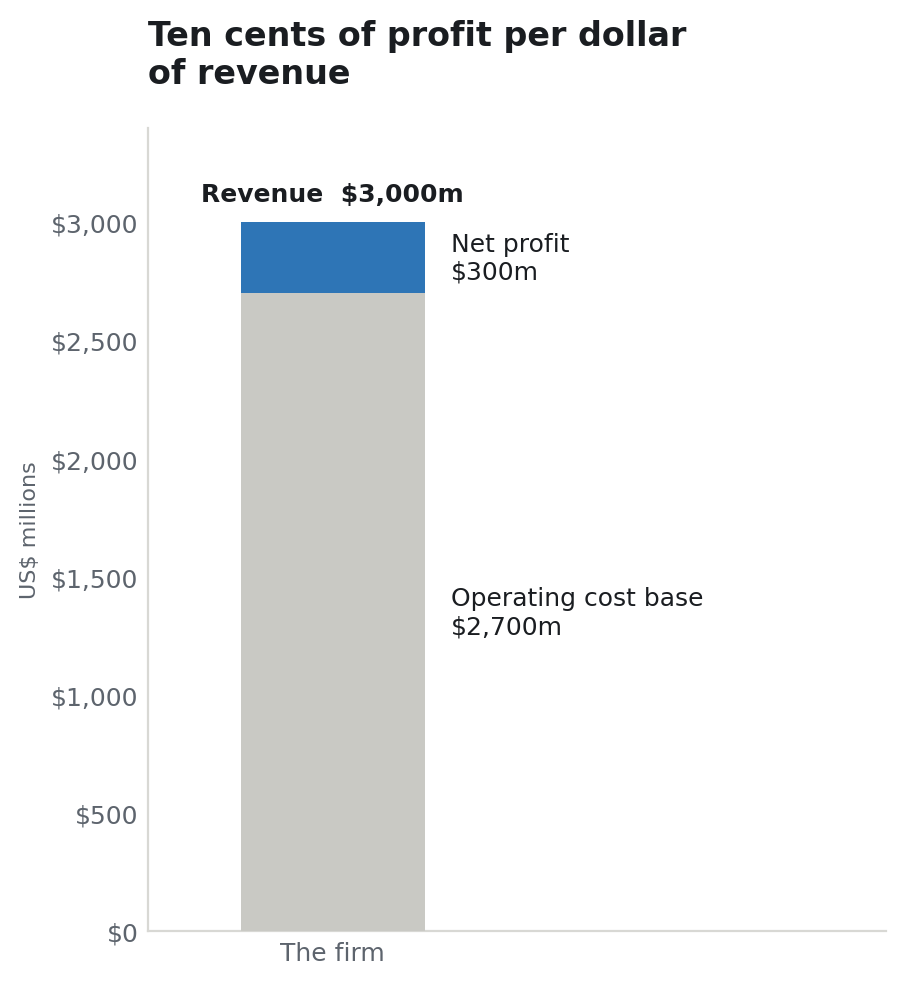
Figure 1 · Illustrative firm, Calx NEO scenario model · annual, US$ millions
National accounts, such as GDP, count the value added by an enterprise, not the gross revenue. It counts wages, depreciation, production taxes, operating surplus, and more. For this plant, that could be $750m, with the rest being bought-in feedstock, energy, and services that would count to their suppliers’ contributions to the economy. That $750m itself here breaks down into $300m of profit and $450m of net value add.
A bad day makes a bad year
In the year under consideration, the plant suffers a serious chemical release, and explosion. The fireball makes the nightly news; a breathless TV reporter shows ambulances pulling up at the hospital.
The factory shuts down for a week, and loses ten days of output once ramp-down and restart are counted. A hundred and fifty people are harmed. A hundred have breathing problems bad enough to need a few days of rest. Forty-five are admitted to hospital for about two days. Five are in intensive care for an average of fifteen days but then die.
The survivors carry a long-term burden we judge at 0.2 DALYs (disability-adjusted life years) each, an averaged fifth of a year of healthy life, lost to scarring, reduced lung function, and the ordinary attrition that follows a serious chemical exposure.
This, sadly, is also a somewhat normal accident. It’d make the news, briefly. Releases of roughly this size happen somewhere in the industrialised world several times a year. What follows is simply the arithmetic of one of them, done twice.
What GDP sees
Start with what the national accounts record, what GDP counts. This starts with the firm’s value added: The shutdown subtracts ten days of production. The victims' lost wages subtract their missed work. Everything else adds to GDP.
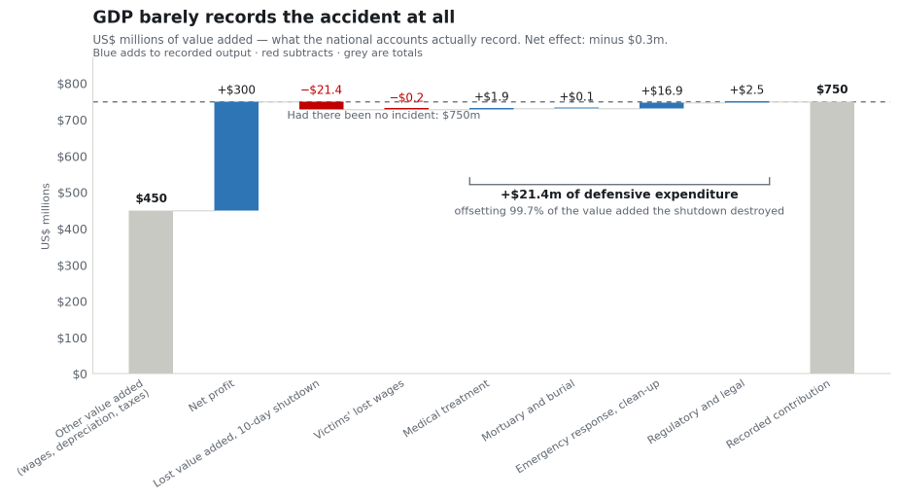
Figure 2 · Calx NEO scenario model · one plant, one year, US$ millions
The hospital bills are economic output. The ambulances are output. The funeral directors, the cemetery, the medical examiner, all output. The hazmat teams, the contractors decontaminating the site, the lawyers on both sides of the regulatory proceedings, all output. $21 million of it, offsetting a quarter of the production the accident destroyed.
The arithmetic nets to a reduction in recorded economic activity of $0.3m. Three hundred thousand dollars, against a $750m value add economic contribution, in a year the plant killed five people. In the national accounts the accident is, within rounding errors, free.
The five deaths are not in the chart. A death enters the GDP only through the money it moves: $16,400 of funeral, burial and medical and legal spending per person. Five lives lost, recorded as $82,000 of economic stimulus.
This is not a measurement error. GDP is doing what it was designed to do in the 1930s: to count production. Any error is ours, for having asked it the wrong question.
What NEO sees
Now run the same twelve months through a Net Economic Output statement, the same firm and the same accident, but different accounting. Every line that GDP added for the consequences of the accident is seen as a cost. What GDP adds as economic activity caused by the accident, NEO subtracts, because each is a cost of the accident rather than a valuable outcome of the plant’s operations. And NEO adds lines GDP has no record for: the five lives, and the lasting ill health of the survivors.
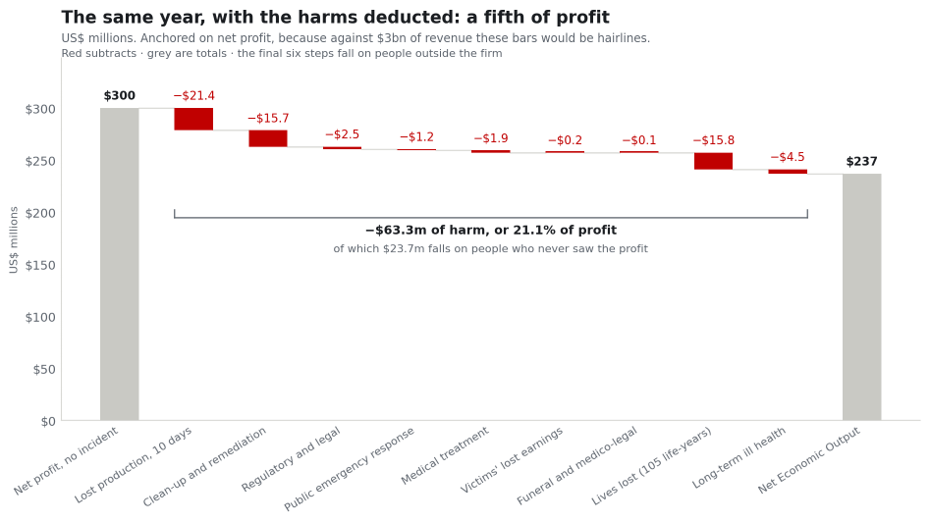
Figure 3 · Calx NEO scenario model · one plant, one year, US$ millions
This is a better picture, more precisely depicting what we experience: $63.3m of harm, equivalent to 21% of the plant’s annual profit. The largest item, beyond the lost production, is the $15.8m for five lives, valued at 105 discounted life-years. Next comes $15.7m of site clean-up. The treatment of a hundred and fifty casualties is $1.9m, about a tenth of what it costs to wash down the plant. And $23.7m of the total, 35%, falls on people outside the firm entirely: the victims, their families, and the county that sent the hazmat trucks and their suited teams.
We use profit, not revenue or value add, as the basis of comparison. We do this for both practical reasons, to align with what the firm is measured against, and for consistency. The $63.3m of harm is 2.3% of the firm's revenue. But it’s 21% of its profit. Further, profit is a number the firm cares about: the board optimises, a shareholder receives a portion as a dividend, a tax authority assesses for taxes. Putting external costs against revenues also mixes a gross flow with a net deduction, which produces a figure that is neither an output number nor a profit number.
An algebraic note: In GDP terms, the hospital and mortuary costs, etc. (about $21m here), are included as positives in computing economic activity. In NEO terms, those are considered negatives, as part of the harm that should have been avoided. The difference between the totals created using GDP style accounting and those created using NEO style accounting is double the hospital and mortuary costs. That is mathematically necessary, converting a credit into a debit as the entry shifts from +$21M to -$21M, so the shift from GDP style to NEO style is $42m.
This seems about right. The harms aren’t helpful, they’re costs.
The second layer: what to do about it
While netting out harm is the first thing NEO does, it also is important to do more than value harms; we must step forward to create value. Once a harm is priced, the interventions that reduce it can be priced too. Interventions are not miracles. They cost money, they work imperfectly, and they carry harms of their own. All three belong to the same statement.
So take the plant forward a year. Suppose insurers price to a 25% annual chance of a comparable release. Suppose reasonable engineering — better containment, detection, interlocks — removes 85% of that risk at a 4:1 return.
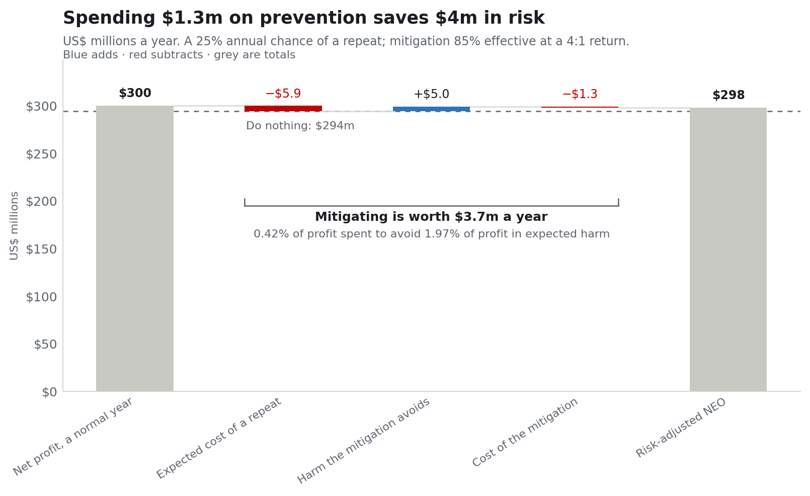
Figure 4 · Calx NEO scenario model · forward-looking, annual, US$ millions
The numbers are almost embarrassingly small. The expected externality is $5.9m a year. The mitigation costs $1.3m and avoids $5.0m of it, netting $3.7m. As a share of the firm's profit, that is 0.42% spent to avoid 1.97%.
The reason it gets overlooked, routinely, across every industry, is that the number is rarely computed and shown. Since the costs to be insured against are outside the confines of the chemical plant, there’s little incentive to deal with them. Of the harm at stake, $23.7m lands on people the firm has no accounting relationship with, so it never reaches the firm’s accounts.
Thus the issue that NEO solves. The problem is rarely that the economics of prevention are unfavourable. The problem is that the arithmetic is rarely done.
From one plant to a whole economy
Our story of one imaginary plant and one imaginary accident is a parable. The parable about the factory sets aside that when the factory works well it emits fumes that, downwind, cause harms, and its water waste contains chemicals that seep into the ground. There’s no fireball, no line of ambulances, no cleanup crew in hazmat suits. The sick and the dead are even more invisible than those for the accident.
Let’s generalize. Do this for every firm or facility in a sector and you have a sector statement: one column totalling the monetary value of what the industry produced, a second tallying the harms that production caused, and a new bottom line. Do it for every sector in a country and you have a national one.
That is Net Economic Output. GDP measures what an economy produced. NEO measures what it produced, net of what producing it cost in damages to health, and to the environment and the costs of remediation.
We already know roughly what some of those sector statements would look like, and the answers are not comfortable. Apparel's are of the same order as its revenue. A sector can have a negative NEO while appearing handsomely profitable — producing less value than it destroys, and surviving precisely because the destruction is unpriced. This is precisely where the coal industry is today: its external costs run to about 6 times gross revenue, or perhaps 8 times the implied value add of the industry. GDP cannot represent that state.
Why a new structure, rather than a better number
The obvious objection is that little of this is new. Economists have used the word externalities to describe external harms since Pigou in 1920. Half a dozen serious alternatives to GDP already exist, listed in the appendix below. Why add another acronym?
Because the existing options each solve a different problem from the one that actually needs resolution.
Against the P&L. A profit-and-loss statement is a complete record of a firm's transactions, but contains nothing about their consequences. It is not dishonest; it is bounded within the set of people the firm has a contractual relationship with, and externalized harm falls outside that boundary. In our scenario $23.7m of damage falls outside it. NEO keeps P&L intact, but extends the boundary to everyone the firm's activity touches.
Against GDP. GDP is a production measure. It does that well, particularly since by compiling a tally of the value added by each entity it avoids double counting. Modifying it to net out harm breaks what it is. Patching costs onto GDP would damage what it does reliably: a single figure on output: a single figure adjusted for externalities cannot tell you if output rose or damage fell. NEO sits beside GDP rather than replacing it. We need both, and we need the gap between them.
Against existing alternatives. Green GDP and SEEA are built for natural capital and are strongest on depletion — forests, fisheries, minerals. They are thin on human health, and health is where most of the money is. The Inclusive Wealth Index and the Dasgupta Review measure stocks rather than flows, which is intellectually the most respectable position available and operationally the hardest to act on annually. The Genuine Progress Indicator does roughly what NEO does but has spent thirty years contested on methodology, largely because it folds subjective wellbeing adjustments into the same number as physical damage. Firm-level work from IFVI and the Value Balancing Alliance is the closest relative, and the most promising — but it reports a company's impact rather than nesting into a national account.
None of them takes the next step, one that makes the number useful: pair each harm with the priced interventions that reduce it. A measure that tells a government minister that some category of harms total to $400bn is interesting. A measure that tells her which $12bn of spending removes $90bn of it is a valuable step toward a decision. Pricing interventions in the same system that prices harms creates the basis for decisions on the best paths to risk mitigation, to building a future of health and environmental vigor and prosperity.
One further structural point. NEO is designed to be deconstructable, analyzable, connected to data with known provenance. A national figure that cannot be traced back to a sector, a firm or a facility is a rallying call for angry activists, or a talking point on a TV show. One that can is an instrument. It is something a regulator can cite, an insurer can underwrite against, a lender can price into a spread, and a procurement officer can write into a contract.
It’s like pricing carbon. Having useful numbers can change behaviour without waiting for a statute.
The net of NEO
Give an analyst, a risk strategist, or a finance minister both figures — GDP and NEO, current and projected — and they have a new figure: The difference between them is the sum of the externalized harms.
We want NEO to rise. We want GDP to rise. And we want the gap between them to close, first as a share of GDP and then in absolute terms. A shrinking gap means an economy achieving prosperity with less damage per unit of it. That is a measurable goal that can be set, tracked, and have accountability assigned. This moves discussions of sustainability from isolated analyses and essays into the basis for systemic resolution.
Eventually the difference should approach zero. The net of externalities should reach zero. NEO = GDP.
Later still, it could invert. NEO greater than GDP describes an economy whose activity adds more to human and natural capital than it consumes — one investing in health and environment rather than drawing them down. Restoration counted as the value creation it is, rather than as remediation of damage we should not have caused. Implied in this is that the idea of assigning capital value to natural assets flows from the NEO - GDP difference.
That is a long way off. But it is only unimaginable while we lack the instrument to describe it. Calx with NEO sees this as a solvable problem.
Because we choose to
A word on the name. Yes, NEO - Net Economic Output. Net in finance is the amount left after all necessary deductions. Gross is before any deductions.
Neo is Greek — néos, νέος: new, young, recent. GDP accounting was designed in the 1930s for an economy that no longer exists, by people who surely did not anticipate what production would come to cost.
And yes, Neo is also the protagonist of The Matrix movies, always featuring the awesome Keanu Reeves. Two allusions are worth the indulgence.
When Neo confronts the Architect in The Matrix Reloaded, he is described as “the sum of a remainder of an unbalanced equation inherent to the programming of the Matrix”. An unbalanced equation inherent to the programming is a fair description of an economic system that counts the ambulance and not the injury. We aim to balance it.
The second comes near the end of Revolutions, when Agent Smith demands to know why Neo keeps fighting for things that cannot be weighed — freedom, truth, love. The answer is: “because I choose to.”
The harms of industry are not laws of nature. They are the accumulated residue of an unbalanced equation, a measurement system that cannot see them, maintained by people who could choose otherwise. Every one of them is authored, profitable, and reversible. It’s time for a new system to enable and to drive that.
Neo. We choose to.
Appendix A - the approaches
Robert Kennedy's observation has not gone unanswered. These are the main responses:
| Approach | What It Does | Status | Where NEO Differs |
|---|---|---|---|
| Green GDP | Adjusts GDP downward for natural capital depletion and environmental degradation. | Various national pilots; no standard. | Thin on human health; produces one adjusted figure rather than keeping output and damage separable. |
| Gross Ecosystem Product | Values the flow of ecosystem services. Developed by Ouyang Zhiyun, Gretchen Daily, and colleagues. | In use in Chinese provinces. | Ecosystems only; no industrial harm, no health. |
| SEEA (UN System of Environmental-Economic Accounting) | The statistical infrastructure behind both of the above. | Adopted as a standard in 2012; Ecosystem Accounting added in 2021. | A framework for environmental accounts rather than a measure; NEO could report into it. |
| Inclusive Wealth Index / Dasgupta Review (2021) | Measures stocks of produced, human, and natural capital. | Influential; the strongest intellectual position available. | Stocks, not flows. Dasgupta's framing is right; it is just hard to act on annually. |
| Genuine Progress Indicator / ISEW | Adjusts consumption for inequality, defensive expenditure, and environmental cost. | Thirty years old, methodologically contested. | Mixes subjective well-being adjustments with physical damage in one figure, which is largely why it is contested. |
| IFVI and the Value Balancing Alliance | Firm-level monetised impact valuation. | Active, maturing; the closest relative. | Reports company impact; does not nest into a national account or carry an intervention layer. |
| UN Beyond GDP | Political commitment to a complementary-measures framework by 2030. | “Valuing What Counts” brief, 2023. | A mandate rather than a method. Someone has to supply the method. |
In summary: the measurement problem has no shortage of frameworks and a severe shortage of defensible numbers to put in them. We are attacking the second problem, with a framework that seems robust enough for general use.
Appendix B - what the model does
If you want to understand the numbers, either to look into our theoretical accident or, more usefully, to understand how NEO accounting works, write to us and we’ll share the underlying model.
The four charts are driven by a single model spreadsheet in which every figure is a live formula or a data input point. This note describes what it contains.
Scope. One plant, one year, one acute incident. $3bn of revenue at a 10% net margin — $300m of profit — which sits at the top of the commodity petrochemical range. US prices, 2025 dollars, at commercial-payer allowed amounts rather than list charges — gross hospital charges would be roughly 2.5–3.5× higher. A Gulf Coast chemicals metro is the basis for local cost estimates. The costs and consequences reflect a US cost basis, but the model can be generalized to any region.
The casualties and what they cost. A hundred mild cases treated and released at $2,685 each; forty-five admitted for two days at $18,280; five ventilated in intensive care for fifteen days at $158,500. Each figure is built from its parts: ambulance, emergency department, per-diem bed, professional fees, imaging and pharmacy, follow-up. Total medical treatment: $1.88m. Funeral, burial and medico-legal costs run to $16,400 per death, $82,000 in all. Lost earnings total 825 working days, $198,000 at median US wages.
The health burden. 135.4 DALYs. Of these, 105.7 are the life-years lost by the five who died — mean age 45, life expectancy 79, discounted at 3% in line with US regulatory practice. A further 29.0 are the 0.2-DALY long-term burden carried by 145 survivors, and 0.8 is acute morbidity during treatment. Valued at $150,000 per DALY, the burden is $20.3m.
Lost production and response. Ten days of output valued at the contribution margin (revenue less the variable costs that stop with the plant) which, with variable cost taken as equal to intermediate consumption, is 25% of revenue and gives $21.4m.
Response and clean-up. $15.7m of site decontamination and three-year remediation, $2.5m of regulatory and legal cost, both borne by the firm; $1.2m of public hazmat response borne by county agencies.
The value of human life dominates. The valuation of a life-year drives more of the result than the direct medical costs.
At $50,000 per DALY the total harm is $54.0m, or 18% of profit;
at $500,000 it is $115m, or 38.3%.
Valuing the deaths the way the US Department of Transportation would (a $13.2m statistical life rather than through discounted life-years) takes the total to $117.7m, or 39.2% of profit.
Disputing the ICU per-diem is focusing on $100,000, while the value of a life-year contributes about $61m to the overall outcome. We used mid-range values throughout.
What the model omits.
Insurance. A plant this size carries property, business interruption and liability cover. If those policies respond, the firm's reported P&L may be barely marked — which does not undo a death, and does not reimburse a county for its hazmat trucks. Insurance changes who pays and when, not what payments need to be made, nor what was destroyed. If a firm's accounts can absorb a five-fatality incident without a visible mark, that is an argument for NEO, not against it.
Litigation. A five-fatality US release would generate lawsuits that would be settled for amounts from the tens to low hundreds of millions, dwarfing every figure here. We exclude settlements because they are a transfer, not a cost: $60m moving from the firm to the victims does not restore a life-year. Further, litigation and settlement is mostly specific to the USA. Counting them as harm would double-count damage already valued in DALYs. NEO measures damage; the P&L handles compensation.
Everything chronic. This is one acute event. The routine permitted emissions of a plant like this almost certainly cause more cumulative harm over a decade than the spill does in a year — and they generate no news story, no clean-up bill and no chart.
Also absent: supply-chain propagation, substitution if the plant closes, latency of twenty years in chemical exposure harms, and any distributional view of who within the fenceline community bears what.
Standing of these figures. The firm and the incident are fictitious. The numbers used in the model derive from a simple depiction, aiming for output that turns on orders of magnitude - treatment in low single-digit millions, clean-up in tens of millions, health burden in tens of millions. The estimates scale and are representative of many accidents, but that isn’t the real point. The objective of the model is to illustrate how the caustic costs of business show up as a boon in GDP, and how they can be corrected in NEO. Doing this properly, at scale, with sourced numbers and published model parameters and acknowledged ranges of uncertainty, is the work ahead.